Run Inference
Freeze the panel and inference YAML before viewing post-treatment results, then run:
Use --data to override only the CSV path and --no-create-plots to suppress
plotting. The command returns non-zero when the stage raises an error or the
result status is failed.
Review outputs in this order:
data_validation.jsonfor panel construction and window metadata;assumption_validation.jsonfor advisory pre-trends/interference and any explicitly requested experimental pre-period placebo gate;geolift_results.jsonfor status, unscaled ATT, p-value, interval, placebo count, granularity, warnings, and errors;geolift_diagnostics.jsonfor pre-fit and fitted donor-weight diagnostics;uplift_timeseries.pngas a visual diagnostic.
Summary intervals use the recorded ci.level and unscaled nested bounds.
Disabled or unavailable primary intervals remain unavailable, even when scaled
diagnostics exist. Partial plots display their limitations; failed or incomplete
primary results cannot generate uplift plots. Regenerate older dictionaries
missing status, estimand or nested interval metadata rather than assigning a
default confidence level. See the result contract.
Describe the result as an estimated difference from the configured SparseSC counterfactual. Causal interpretation requires defensible donor exchangeability, treatment isolation, stable measurement, timing, and absence of material unmodelled shocks. The advisory interference screen cannot prove or disprove spillover.
Read the estimated effect
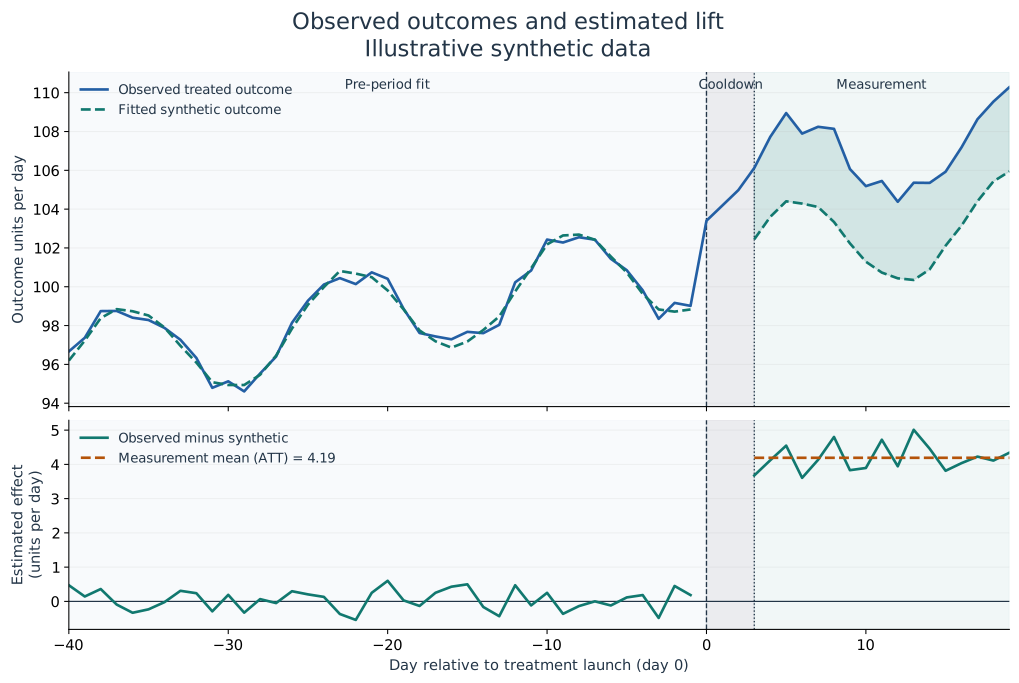
This synthetic example illustrates the distinction between the outcome path, period effects and their measurement-period average. It is not an output from your campaign. Read the worked explanation before interpreting the equivalent diagnostics in your own run.